Business Intelligence (BI) has gone from a technology primarily for large companies and has become a diverse set of tools that are beneficial and affordable for small and mid-sized companies. Integrating data from multiple business applications and data sources allows teams across the entire company to access meaningful information and make better decisions, faster.
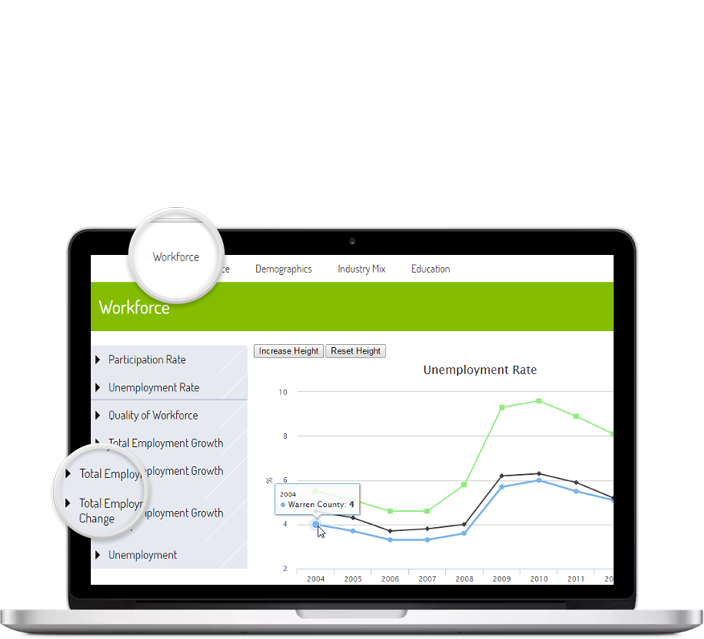
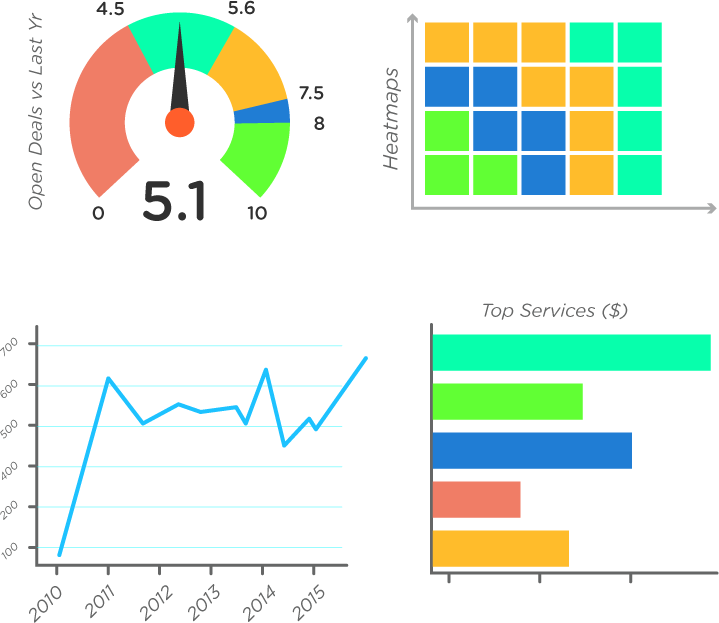
Business Intelligence is a method of leveraging internal and external company data to provide meaningful insights to your organization through tabular reports, spreadsheets, charts, and dashboards. By providing your team with easily accessible and understandable analytical data, they will be empowered to work more efficiently and to make decisions that are more impactful for your business objectives.
There is a variety of business intelligence (BI) tools to choose from. All address the increasing analytical needs of businesses of all sizes, but determining which BI tools are right for your organization can be complicated. Velociraster can help determine which BI analytical tools can best fit your needs and budget.
Although a newcomer to the BI arena, Amazon's entry is not to be taken lightly. With an amazingly affordable price, QuickSight offers a fast, cloud based BI service that makes building visualizations easy, the ability to perform advanced analysis, and dashboards that can be accessed from any browser or mobile device.
Tableau is the industry leader when BI data visualizations are what you need. They have a strong reputation for having the most user-friendly interface, which makes it very approachable for non-technical users. Customizable dashboards easily connect data from nearly any data source with many drag and drop solutions. Simplicity comes at a price though. We can help you sort out the various Tableu features and pricing to see if it is the right choice for your organization.
If you are already invested in a Microsoft centric stack, Power BI is the first place to look. Due to the integration with other Microsoft solutions, Power BI has an advantage of easy setup. Due to it being a somewhat of a newcomer in the BI space, its analytical depth is a little more shallow than others. However, if your needs are simple visualizations, modest analytics, and powerful reporting, Power BI will serve your organization well, and Velociraster can help get you up and running.
Qlik's offerings strike a nice balance of price and depth. Although there can be a deep learning curve if you have deeper analytical needs, having the option for such depth at a fair price can be of great value. If your needs are more visual oriented and you need tools for non-technical users to discover trends in data, Qlik can offer many of the advantages Tableau offers. Velociraster can help you determine whether your requirements intersect with their feature sets.
Sometimes you can bend existing solutions to your needs, and sometimes it's just too far of a stretch. This is where Velociraster's strong technology skills come in handy. Customizations do your BI needs can take on many forms, and we will help you understand your options. It is possible to customize existing BI tools with custom tailored code - and that can work great in the right situations. Sometimes it can be more efficient to build a niche tool for an isolated tasks - whether that be visualization or analytical in nature. For example, maybe you need some D3 based visualizations to augment some BI visualizations, or a custom dashboard, or if your existing analytic tools aren't enough we can write some custom R or Python to address your specific needs. No matter your situation, we will help you see the big picture and discuss together the possible paths forward.
Identifying key performance indicators (KPIs) will have the greatest influence on advancing your BI objectives. A little extra organizational and planning time isolating a strategy for what KPIs to establish will save you many hours to data mining down the road. However, we also understand it might not be possible to compartmentalize all our your metrics out of the gate. We will work with you on a plan for how to introduce new KPIs in the future, and also how to go about discovering new KPIs as you 'use' your data. Chances are many of the patterns and trends in your data you don't know about right now, and will later be discovered by using your BI system. This feedback loop of KPI discovery and streamlining will be a valuable process added to your organization.
Where are the various places useful data comes from in your organization? Do you have a variety of databases you access? Spreadsheets in dropbox scattered around elsewhere? External third party data? The more you know and have documented about your data sources, the easier it will be at later stages when we start to worry about how to clean and organize your data for a BI system.
If your data is not clean, your BI solution won’t be either. It’s important to take time to analyze each data source to gain confidence it contains the type of data you expect it to have. If you don’t take the time for this, all the hours later spent on loading data and analysis will be money wasted. Velociraster’s experienced team helps you see the big picture and helps to avoid late stag pitfalls by ensuring your BI strategy is comprehensive and transparent.

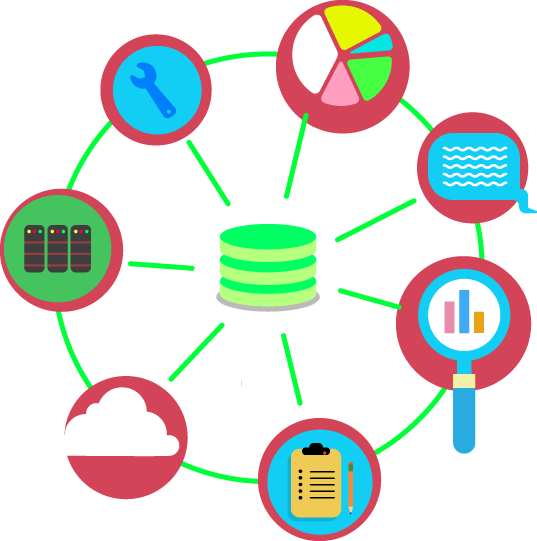
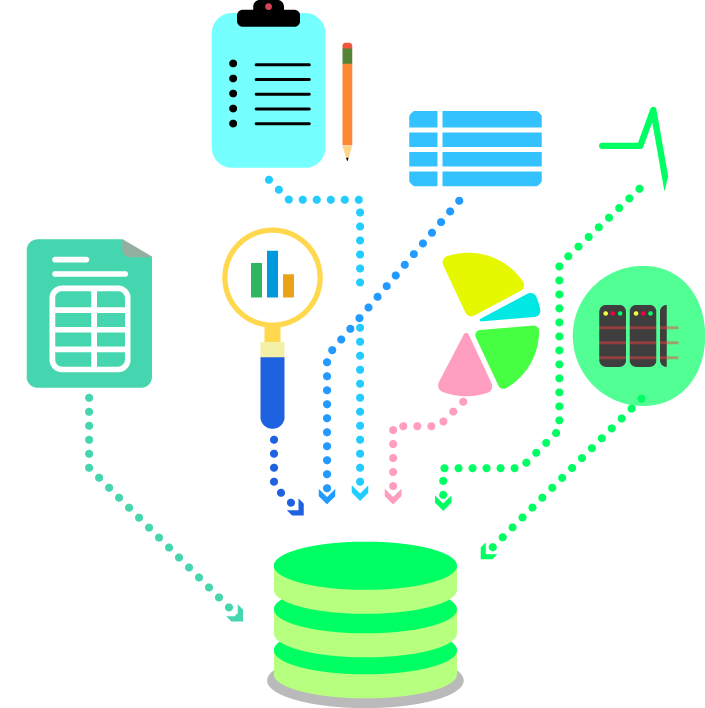
The purpose of a data warehouse is to organize all of your varied data into a central location. This is important so that your BI solution can retrieve and analyze data efficiently. Don’t let the term ‘Data Warehouse’ intimidate. It can easily bring about thoughts of complexity and high costs. You will be very surprised to the sophistication and accessible costs that exist these days. The world of data is rapidly changing and much different than it was even a few years ago. Small businesses can now leverage technology that only years ago costs enterprises extremely large sums of money.

Much of what we have briefly highlighting revolves around a topic more formally called Extract-Transform-Load (ETL). The extraction of data from varied sources, cleaning and preparing the appropriate structure (transform), and then finally populating all of that disconnected data into your data warehouse (loading). This population of your data warehouse is in some ways the final step of preparation, but data is not static and we always need to establish routine to maintain data. This maintenance includes defining how new data enters the system, but also how data in the warehouse is maintained.

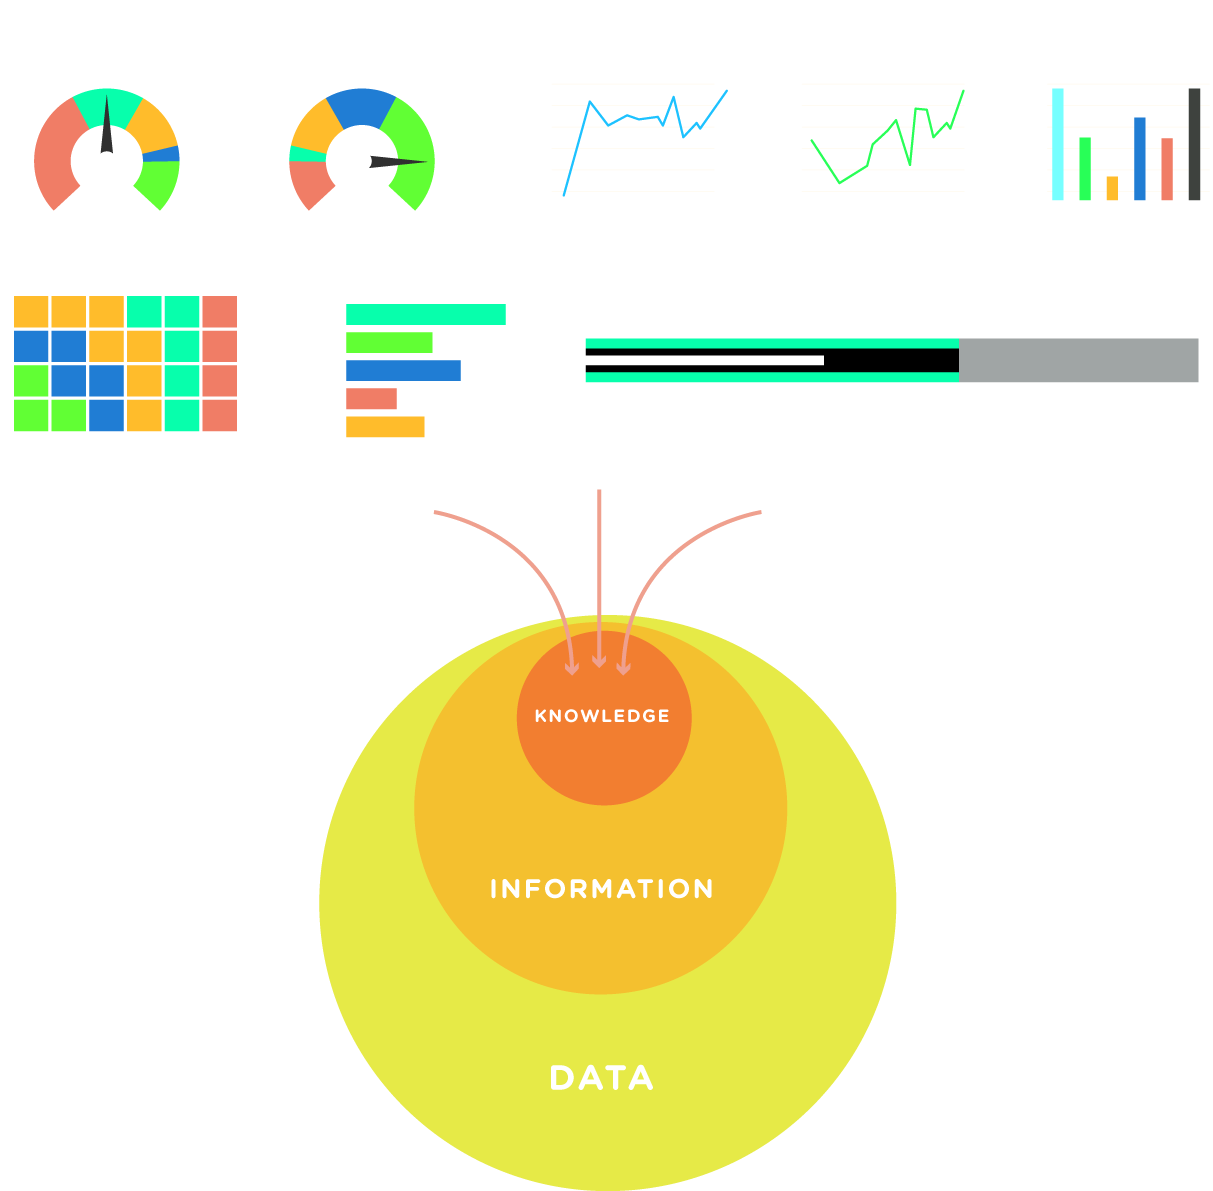
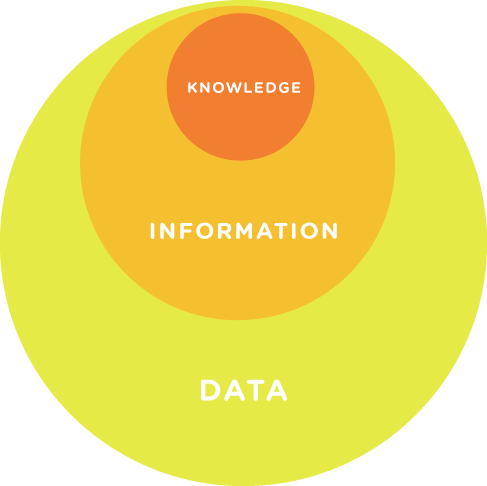
Data visualization enables businesses to better understand data and achieve tactical and strategic objectives. A shift to more data-driven and analytic decision making often feels like something more easily said than done. Its value seems self-evident, but the path towards it might feel fuzzy or like something only big companies do. That doesn’t have to be the case. Velociraster can help businesses of all sizes move beyond spreadsheet based reports and decision making. You know data driven visualizations and reports will help your organization make better decisions faster, but it’s hard to justify such expenses and changes to process. We can help you start with small technology investments, so you can learn the value that can be gained first hand.